Blogs

Blogs
bogoniresearch

South African Elections: A Statistical Safari with the McNamara Test, Chi-Square Contingency Tables, and Logistic Regression

South African Elections: A Statistical Safari with the McNamara Test, Chi-Square Contingency Tables, and Logistic Regression
Greetings, esteemed policy makers and curious readers! Welcome to a thrilling exploration of the recent South African elections, brought to you by Bogoni Research. Today, we dive into the wild world of voter behavior using the McNamara test, chi-square contingency tables, and logistic regression. Sit back and enjoy this journey through the political savannah!

The Electoral Jungle: What Just Happened?
The 2024 elections have wrapped up, and the political landscape of South Africa looks like a bustling savannah. Here’s the lay of the land:

ANC: The once-mighty lion of the electoral jungle, saw its share of the vote drop from 58% in 2019 to 43% in 2024.
DA: Our sleek cheetah, picked up speed, climbing from 21% to 23%.
EFF: The fiery hyena, experienced a decline, shrinking from 11% to 9%.
MK: The newcomer jackal, captured 5% of the vote, assumed to have poached supporters from the ANC and EFF.
The McNamara Test: Uncovering Shifts in Voter Behavior
First up, let’s whip out our trusty binoculars—the McNamara test. This statistical tool helps us spot changes in voter loyalty by comparing paired data, like who people voted for in 2019 versus 2024.

Imagine we had asked voters: “Who did you vote for in 2019?” and “Who did you vote for in 2024?” By comparing these responses, the McNamara test helps us identify significant shifts. Did a significant number of ANC supporters switch to MK? Did EFF voters migrate to the DA? It’s like tracking the migration patterns of our political wildlife.

Stay curious, stay informed, and remember, in the jungle of politics, it’s all about knowing where the lions, cheetahs, hyenas, and jackals roam. Happy exploring!

Read More »
Blogs
bogoniresearch

Navigating Multicollinearity: Understanding Condition Index and VIF in Research

As you embark on the final stages of your research thesis project, it’s crucial to navigate the intricate terrain of statistical analysis with clarity and precision. Among the many challenges that researchers encounter, multicollinearity stands out as a formidable foe, capable of casting shadows of doubt on the reliability of regression results.

Multicollinearity, simply put, refers to the situation where predictor variables in a regression model are highly correlated with each other. This correlation can muddy the waters of interpretation, making it difficult to disentangle the unique effects of individual predictors on the outcome variable. It’s akin to trying to discern the distinct flavors in a complex stew where the ingredients blend seamlessly into each other.

To shed light on this phenomenon, researchers often turn to diagnostic tools like Condition Index and VIF (Variance Inflation Factor). These metrics serve as compasses in the foggy landscape of multicollinearity, providing valuable insights into its magnitude and implications.

The Condition Index serves as an initial litmus test, offering a numerical gauge of the severity of multicollinearity within your model. A higher Condition Index value raises a red flag, signaling a greater degree of multicollinearity among the predictor variables. However, it stops short of pinpointing the exact variables responsible for this tangled web of correlation.

Enter the Variance Inflation Factor (VIF), a more granular measure that delves deeper into the tangled threads of multicollinearity. With VIF, researchers can assess the inflation in the variances of regression coefficients attributable to multicollinearity. A high VIF value acts as a warning signal, suggesting that the estimates of regression coefficients are swathed in uncertainty due to the presence of multicollinearity.

Understanding these concepts is akin to equipping yourself with a sturdy compass and map as you traverse the statistical terrain of regression analysis. Armed with knowledge of Condition Index and VIF, you can navigate the treacherous waters of multicollinearity with confidence, ensuring that your research thesis project stands on solid ground.

Read More »
Blogs
bogoniresearch

Understanding Research Variables: A Comprehensive Guide for Postgraduate Students

Understanding the different types of variables and their roles in research is crucial for developing a robust conceptual framework. This guide provides a comprehensive overview of research variables, helping postgraduate students navigate their studies with confidence. Explore the roles of independent, dependent, control, extraneous, confounding, moderating, and mediating variables, and learn how to apply them in your research effectively.

Read More »
Uncategorized
bogoniresearch

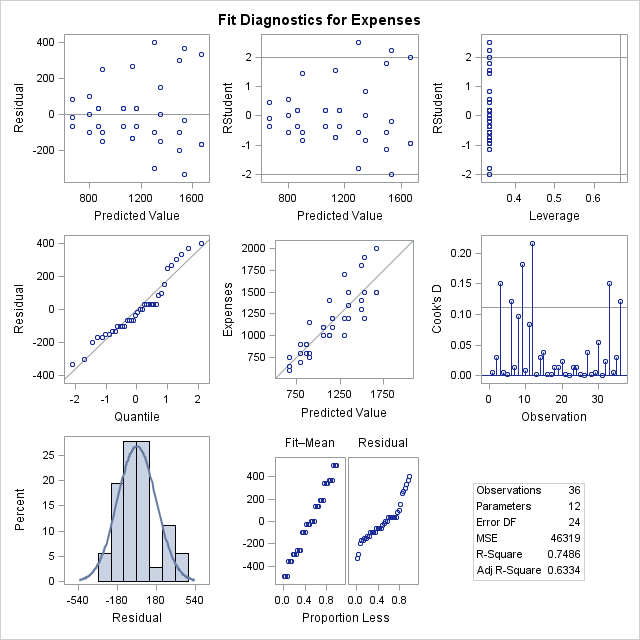
Unveiling Statistical Diagnostic Plots: Interpreting Data Insights

Statistical diagnostic plots are like maps in the realm of data analysis, guiding analysts through the terrain of datasets with clarity and precision. Just as a skilled cartographer deciphers geographic features to reveal hidden treasures, these diagnostic plots unveil insights into data quality, distribution characteristics, and potential anomalies. From the symmetrical bell curve of a mesokurtic histogram to the outlier-detecting whiskers of a box plot, each plot tells a story about the data it represents. Join us on a journey as we explore the visual narratives woven by these essential tools of data exploration and interpretation.

Read More »
Blogs
bogoniresearch

Ensuring Validity and Reliability in Your Research Project: A Student’s Guide

Embarking on a research project as a student is an exciting journey filled with discovery and learning. However, ensuring the validity and reliability of your research findings is paramount to the success and credibility of your study. In this blog post, we’ll explore different types of validity and reliability measures that every student researcher should incorporate into their project.

Internal Validity:
Internal validity refers to the extent to which your study accurately reflects the true relationship between variables. To ensure internal validity, it’s essential to control for extraneous variables that could influence your results. Consider randomizing participant assignment to experimental conditions to minimize bias and increase the reliability of your findings.

External Validity:
External validity pertains to the generalizability of your findings to real-world settings and populations. To enhance external validity, strive for ecological validity by designing your study to resemble real-life situations. Additionally, ensure that your sample accurately represents the target population to increase the external validity of your results.

Read More »
Blogs
bogoniresearch

Unraveling Statistical Metrics: Understanding Coefficient of Variation, Root MSE, and R-squared

In the realm of statistical analysis, researchers are often confronted with a plethora of metrics that serve as guiding lights in the interpretation of data and assessment of model reliability. Among these metrics, Coefficient of Variation (CV), Root Mean Square Error (Root MSE), and R-squared (R²) stand out as essential tools, offering valuable insights into variability, predictive accuracy, and explanatory power. Coefficient of Variation (CV) measures the relative variability of data points, expressing the standard deviation as a percentage of the mean. In a SAS output, CV is presented as a percentage, reflecting the dispersion of data around the mean and signaling potential issues such as heteroscedasticity.

Root Mean Square Error (Root MSE) serves as a benchmark for predictive accuracy, quantifying the average deviation of observed values from predicted values in a regression model. Lower Root MSE values in SAS output indicate better model fit and predictive accuracy, while higher values may suggest the need for model refinement.

R-squared (R²) is a measure of the proportion of variance in the dependent variable explained by independent variables in a regression model. Ranging from 0 to 1, R-squared values in SAS output provide insights into the explanatory power of the model, with higher values indicating better fit and greater predictive capability. Understanding the interpretation of these metrics in a SAS output empowers researchers to assess the reliability and validity of their analyses, guiding them toward more informed decisions and meaningful interpretations of data.

Read More »
Studies
bogoniresearch

Unlocking Customer Satisfaction at Shoprite: Insights from Bogoni Research

Tangibles:
First impressions matter, and our survey revealed that Shoprite excels in many tangible aspects. Approximately 78% of respondents agreed that Shoprite boasts modern-looking stores, while 88% found the physical facilities appealing.

Reliability:
When it comes to reliability, Shoprite fares reasonably well. Sixty-four percent of customers stated that Shoprite gets it right the first time, and 76% believe that services are provided at the promised times.

Responsiveness:
Shoprite shines in responsiveness, with 82% of customers praising the promptness of service. Despite this, 47% felt that Shoprite lacked sincere interest in resolving their problems, indicating a need for improvement in customer engagement.

Assurance:
Customers value assurance, and Shoprite seems to understand this. Approximately 59% agree that Shoprite insists on error-free records, and 60% feel safe during transactions.

Empathy:
Empathy goes a long way in fostering customer loyalty, and Shoprite seems to excel in this regard. Seventy-six percent of respondents reported receiving courteous treatment from employees, while 76% felt that their individual needs were understood.

Overall Assessment:
Using the SERVQUAL model, we calculated an average score of 63% for Shoprite, indicating a satisfactory level of customer service quality. However, there’s immense potential for improvement, particularly in areas such as reliability and empathy.

Read More »
Studies
bogoniresearch

Navigating the Digital Revolution: Insights from Bogoni Research

In today’s rapidly evolving digital landscape, businesses face the pressing need to adapt and thrive in an increasingly digitized world. At Bogoni Research, we’ve been at the forefront of exploring the implications of digitalization, particularly within the banking industry in South Africa. Our recent research endeavors have shed light on the transformative potential of digitalization and its implications for businesses in this dynamic sector.

Through our comprehensive research efforts, we’ve identified key concepts and frameworks that provide a roadmap for navigating the digital ecosystem. Our exploration of frameworks such as the Digital Transformation Framework by Matt et al. has provided valuable insights into the dimensions of digital transformation, including the use of technologies, changes in value creation, structured changes, and financial aspects.

In the context of the banking industry in South Africa, our research has revealed both the challenges and opportunities presented by digitalization. While the potential benefits of digital transformation are immense – including higher process efficiency, lower transaction costs, and better overall control – many businesses are still grappling with the complexities of implementation.

By leveraging digital technologies such as the Internet of Things (IoT), Internet of Service (IoS), and Cyber-Physical Systems (CPS), banks can position themselves for success in an increasingly digital world.

As businesses navigate the complexities of digital transformation, the insights generated by Bogoni Research serve as a guiding light in charting a course for digital success. By embracing digitalization as a strategic imperative and leveraging cutting-edge technologies, organizations can unlock new opportunities for growth and innovation in today’s digital age.

Read More »
Studies
bogoniresearch

Unveiling Woolworths: Understanding Brand Knowledge Structure and Equity Among South Africa’s Black Middle Class

In the bustling landscape of South Africa’s retail sector, Woolworths stands as a towering presence, offering a unique blend of fashion, food, beauty, and homeware. For years, this retail giant has captivated the hearts of consumers, earning a coveted spot among the top brands in the country. But what lies beneath the surface of Woolworths’ success, particularly among the burgeoning black middle class demographic?

Recent research conducted by Boitumelo Oliphant, the owner of Bogoni Research, delves deep into the intricate web of brand knowledge structure and equity within this demographic. The study, conducted on October 9, 2016, as part of marketing research for Woolworths, sheds light on the perceptions, attitudes, and values that shape the relationship between the black middle class and the Woolworths brand.

One of the key findings of Oliphant’s research is the evolving nature of the black middle class in post-Apartheid South Africa. As the country underwent significant political and social changes, so too did the consumer landscape. No longer homogenous, the black middle class emerged as a dynamic force, characterized by increased affluence, education, and purchasing power.

Read More »
WhatsApp chat