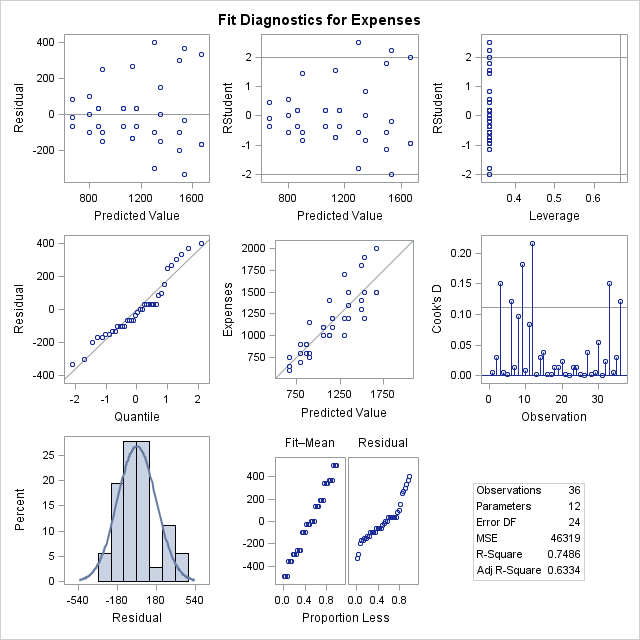
Unveiling Statistical Diagnostic Plots: Interpreting Data Insights

Statistical diagnostic plots are like maps in the realm of data analysis, guiding analysts through the terrain of datasets with clarity and precision. Just as a skilled cartographer deciphers geographic features to reveal hidden treasures, these diagnostic plots unveil insights into data quality, distribution characteristics, and potential anomalies. From the symmetrical bell curve of a mesokurtic histogram to the outlier-detecting whiskers of a box plot, each plot tells a story about the data it represents. Join us on a journey as we explore the visual narratives woven by these essential tools of data exploration and interpretation.

